GO
GO
Home
Interesting
Charts
Compare
Top 1,000
Categories
About
Search:
From:
To:
Smooth
Trend
Events
GO
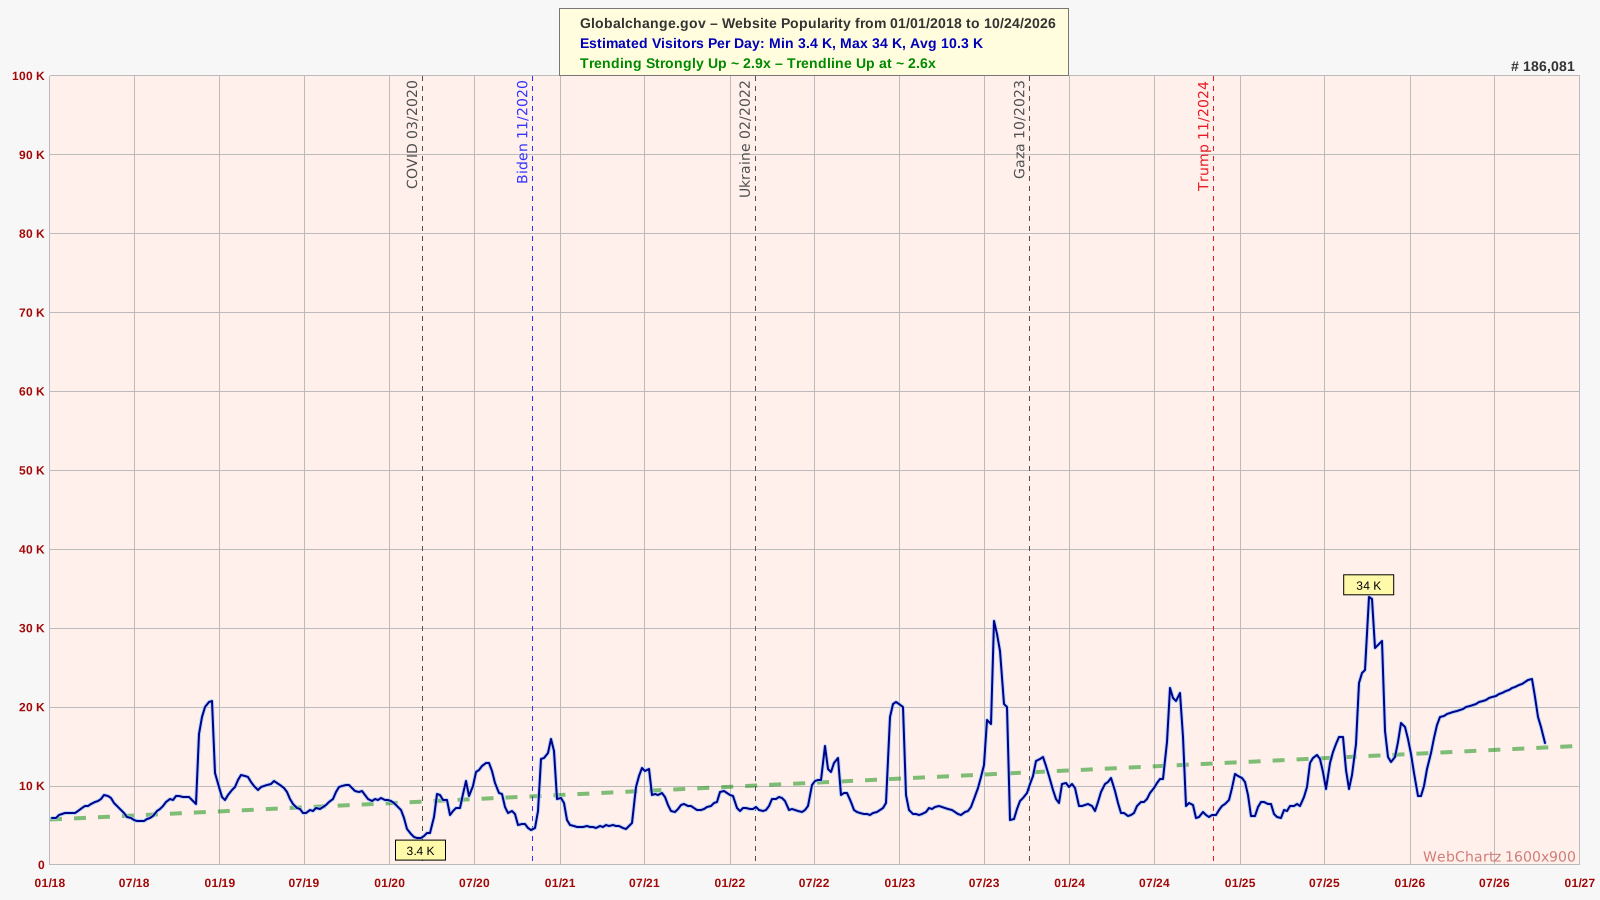
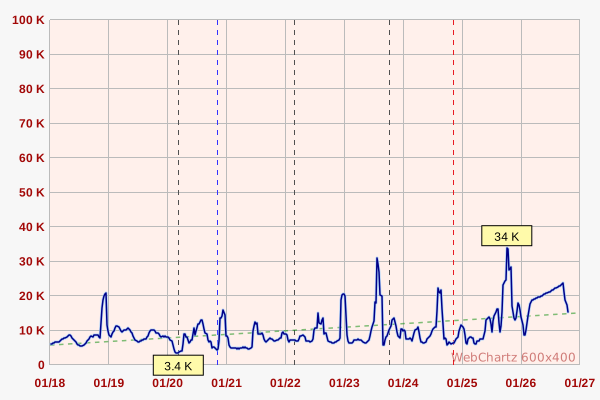
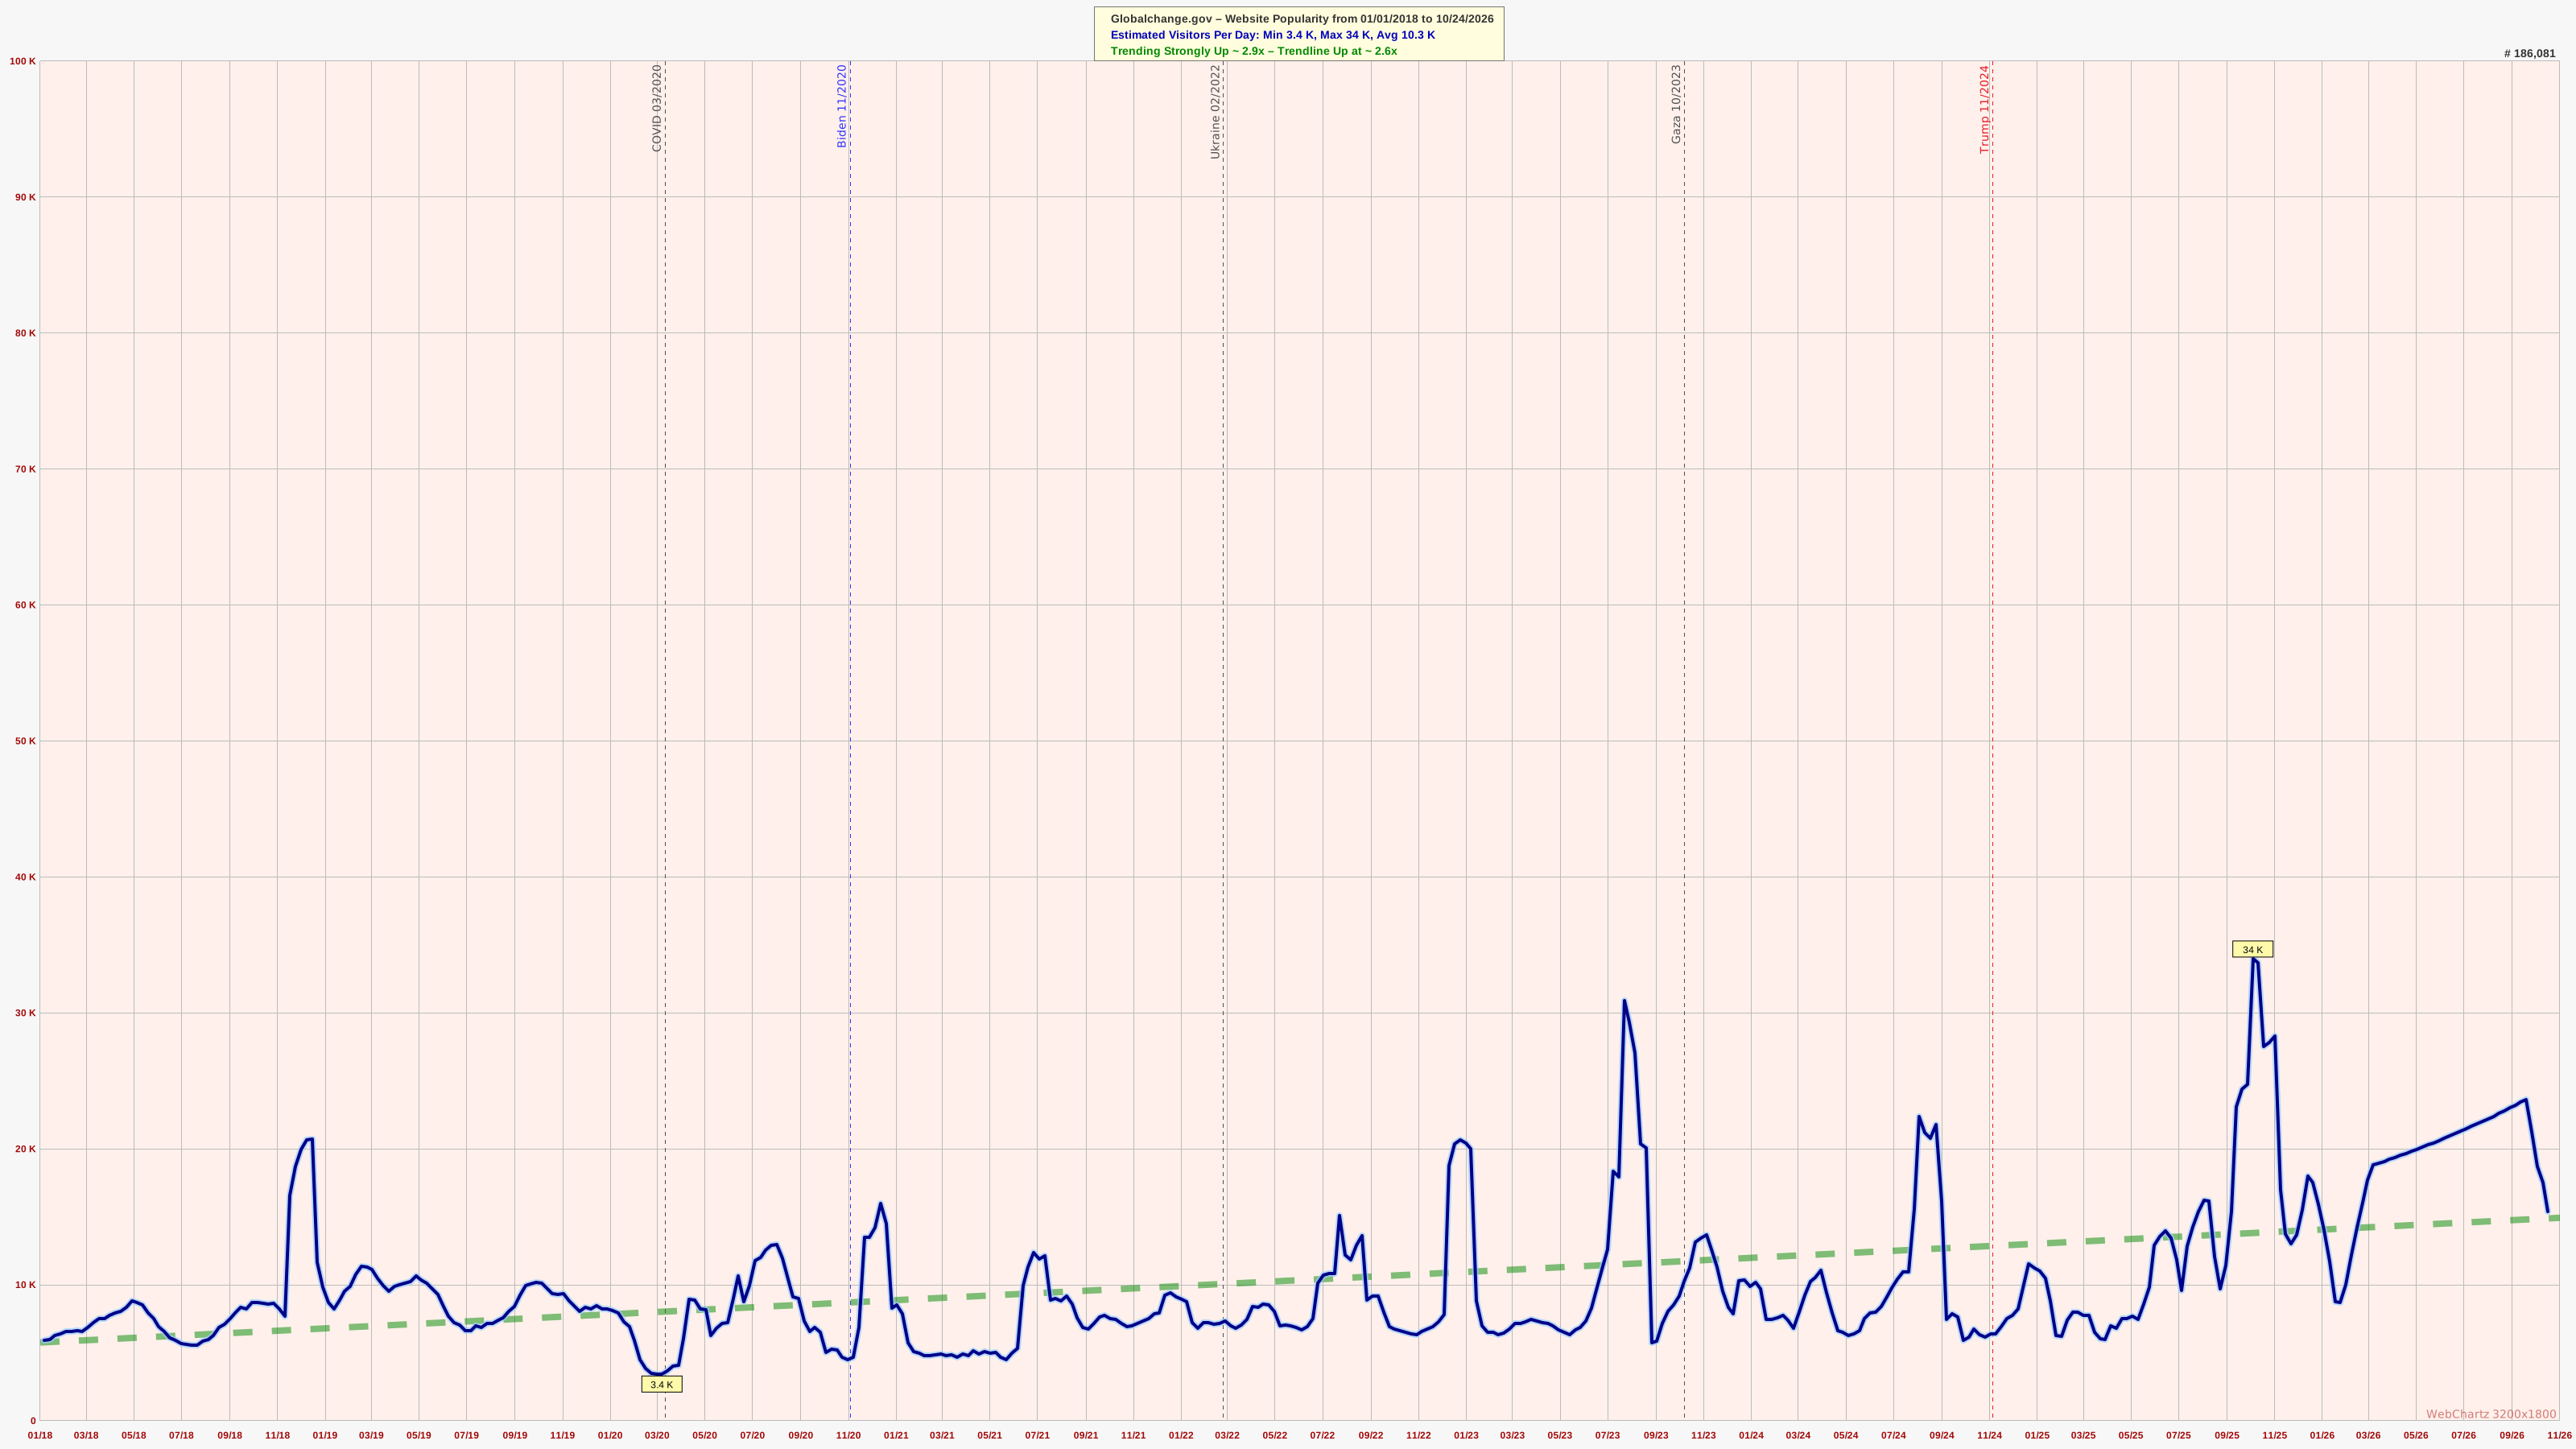
Globalchange.gov Popularity Chart from 01/01/2018 to 10/24/2026
Download Chart Images
600x400
1600x900
3200x1800
×